

Overview
This page records a variant of the pre-event strategy report for the 2026 Dutch Grand Prix, run on race morning with one input changed: the compound degradation gradients. Everything else (base paces, offsets, pit losses, fuel, official tyre allocations, grid, solver settings) is identical to the primary run. The primary run uses the owner’s pre-race priors: Soft 0.11, Medium 0.08, Hard 0.06 s/lap, in the conventional softer-degrades-faster ordering. This variant uses degradation derived externally from the sprint’s official race timing (clean laps, rolling medians): Soft 0.062, Medium 0.102 - Softs lasting BETTER than Mediums. No sprint-derived Hard figure was available, so the owner’s 0.06 is kept, which makes the Hard numbers the one soft spot in this comparison.Investigation only, same footing as the primary page: outside the Watchparty pipeline, no
model_version, nothing written to the platform database, engine 0.1.0-interim run deterministically. The two pages exist to be compared with each other, with the live tool’s own fitted gradients, and with the actual race.Headline Findings
- Soft becomes strictly dominant: all 22 drivers optimise to a Soft start. The Medium-Hard-Hard book that the primary run gives the entire front group disappears from the field completely, and so does the one-stop.
- Everyone two-stops on one of two shapes. Soft-Soft-Medium (Norris, Russell, Antonelli, Verstappen and most of the midfield; first stop laps 23 to 28, second around 51 to 54) or Soft-Medium-Soft (Piastri, Hamilton, Leclerc, Lawson and others; second stop around laps 39 to 43).
- The finishing order barely moves. The podium is unchanged from the primary run; Leclerc gains a place to P4 at Piastri’s expense, and Verstappen drops back behind Hamilton to P7. Base pace and grid position dominate the outcome; the degradation numbers mostly decide how everyone gets there.
- The midfield compresses slightly (the pack lands around +120 rather than +125), while Russell’s gap to Norris grows a touch, from +3.5 to +5.6.
Predicted Result
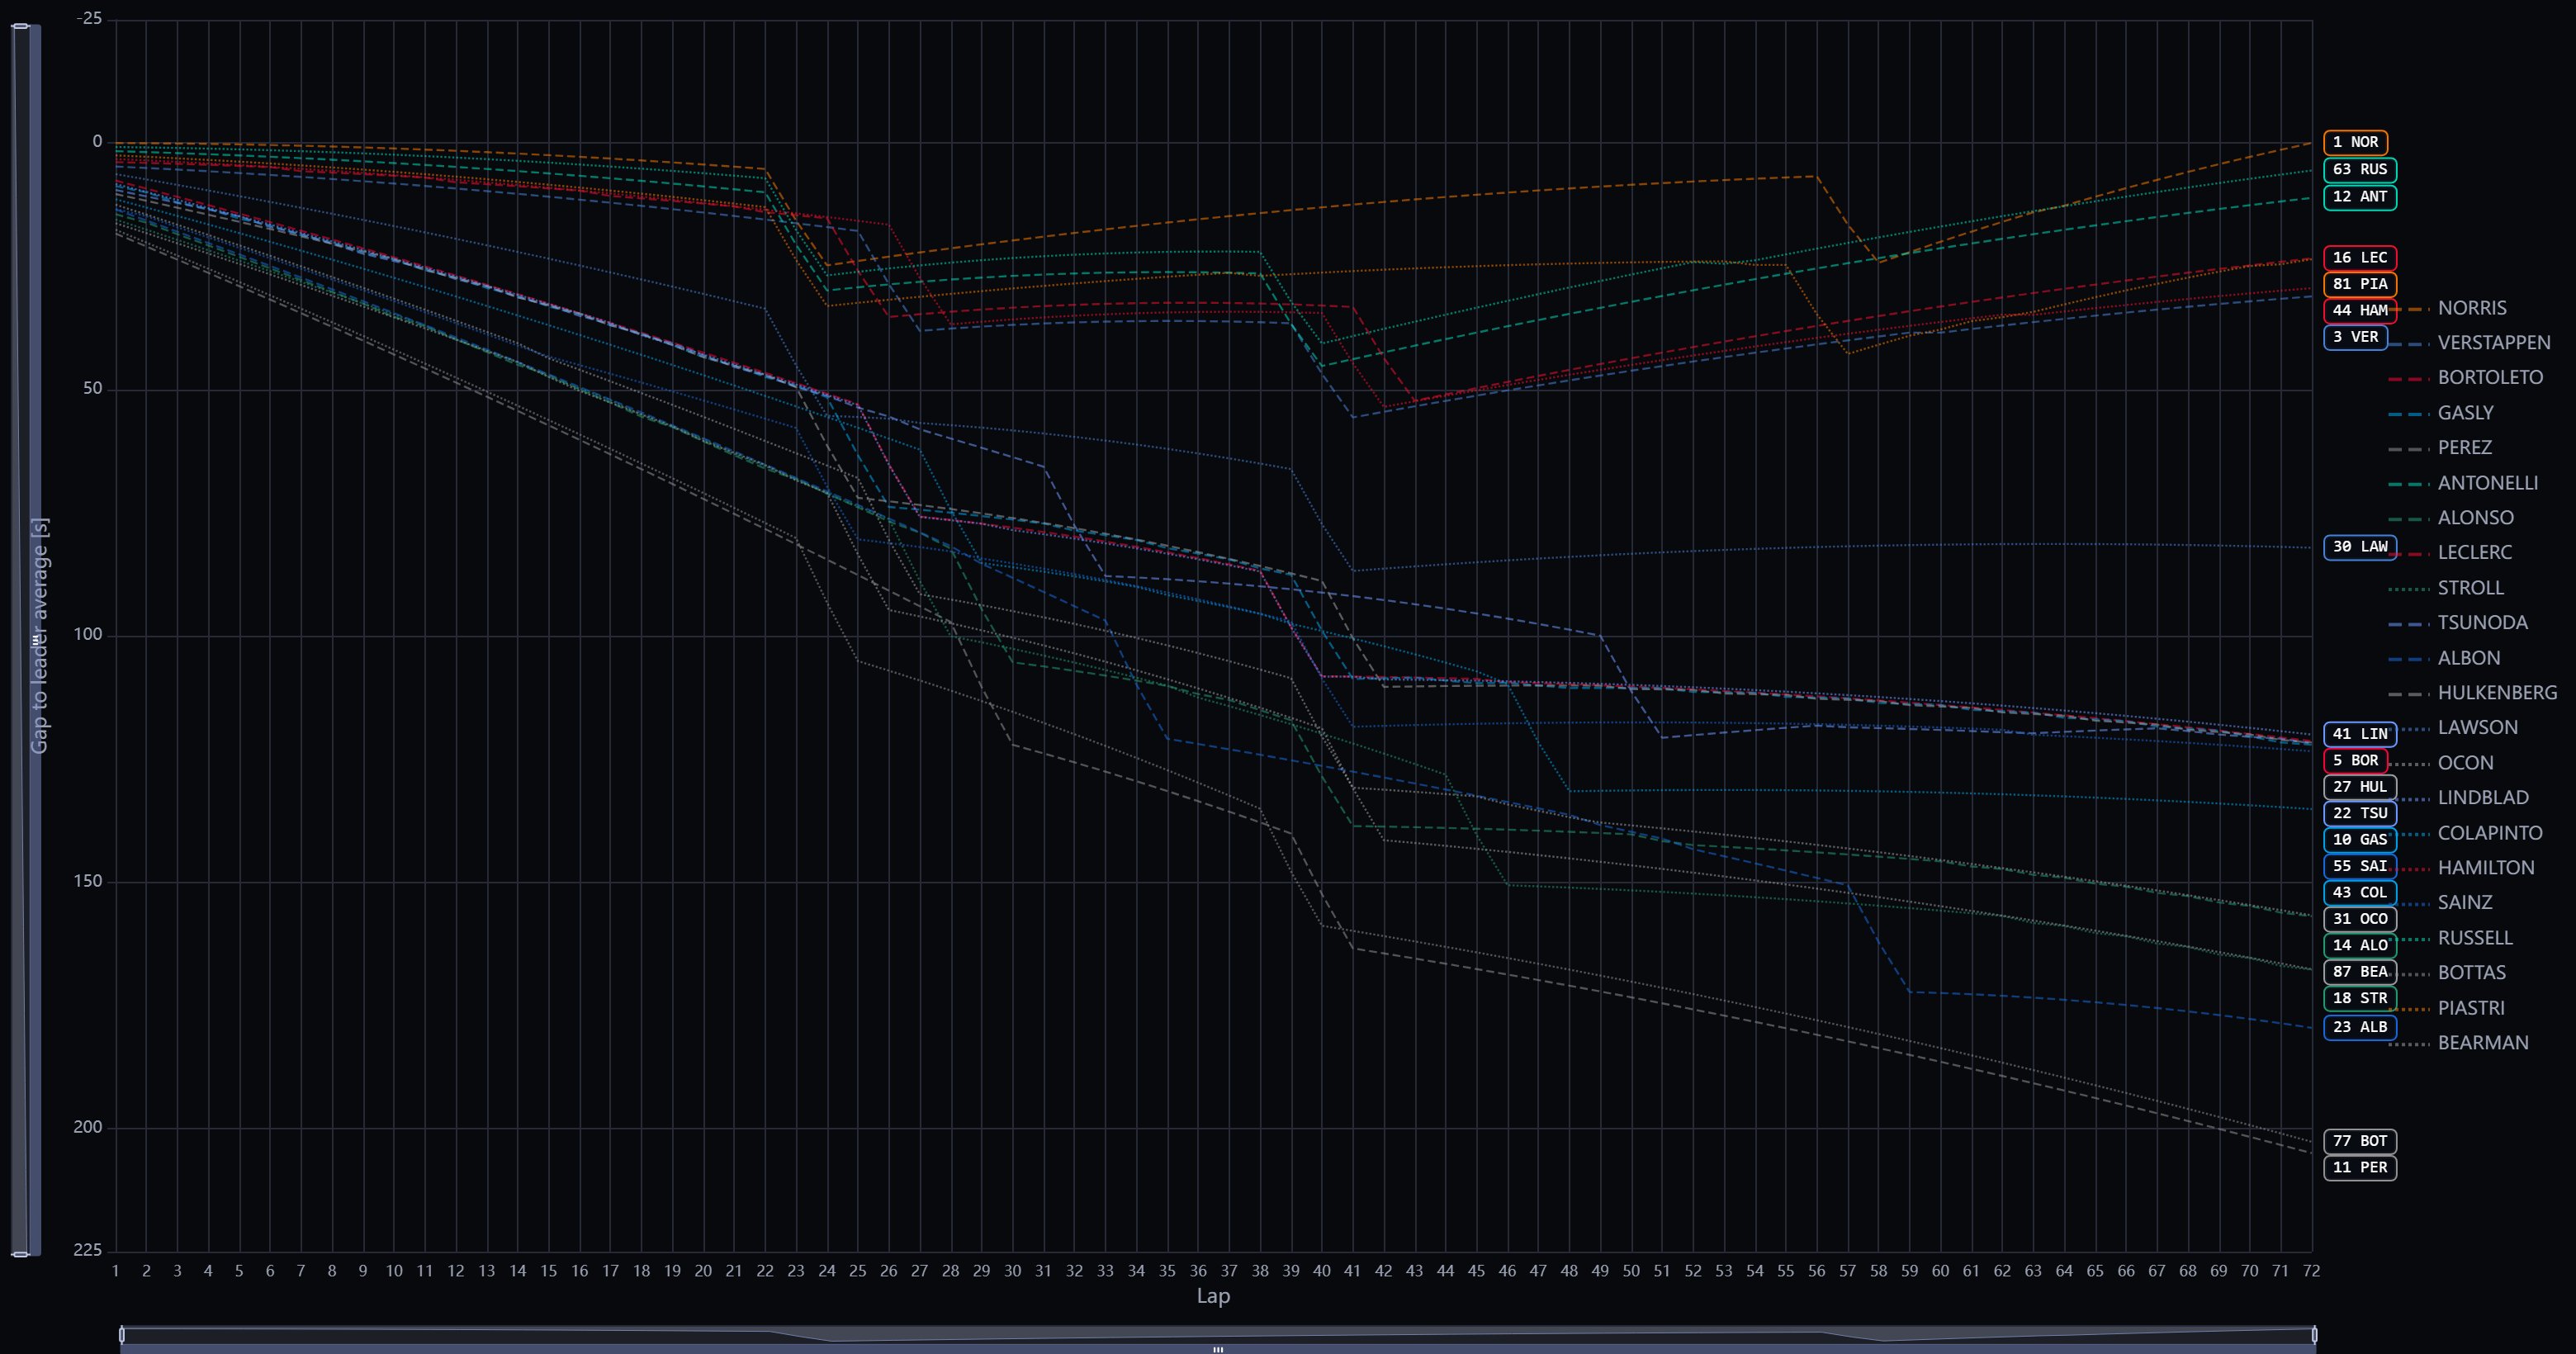
Reading the Two Runs Together
The two runs disagree on exactly one input and diverge on exactly one axis: compound choice. Together they bracket the strategy space.- The grid answers the first question. If the front rows line up on Mediums, reality is closer to the owner priors; a whole field on Softs points at the sprint-derived numbers.
- The live tool adjudicates within the first stint. The Race Strategy Tool re-fits compound gradients from real race laps; its fitted Soft-versus-Medium gradients around laps 12 to 15 (visible in the degradation widgets) say directly which degradation world the race is in.
- First-stop timing separates the shapes. Owner priors predict soft-starter stops at laps 17 to 24 and Medium runners going to 19 to 25; the alt-deg run pushes the whole field’s first stops to 23 to 28.