

Architecture
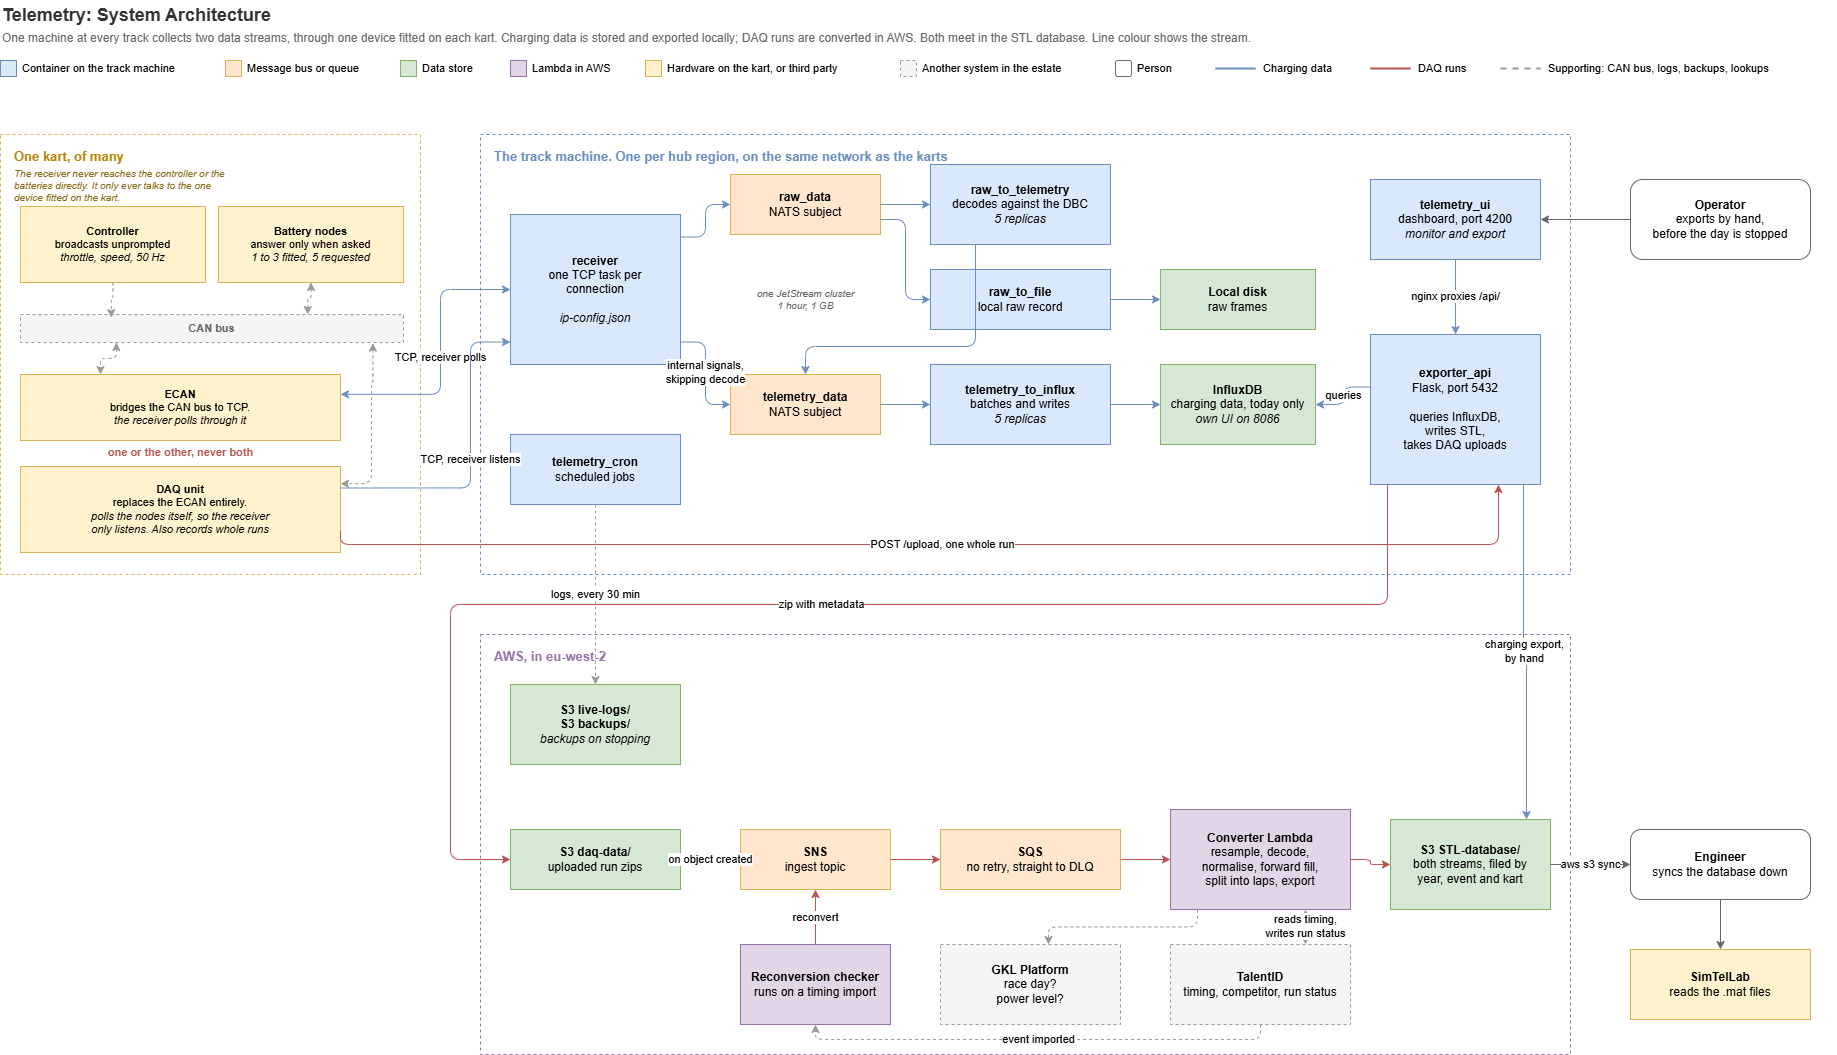
The diagram source is the draw.io file at
images/software/developer/estate/systems/telemetry/architecture.drawio. To change the diagram, edit that source in draw.io, re-export it as PNG to architecture.png in the same folder, and commit both.What Is On A Kart
The left of the diagram is one kart, and it is grouped that way because the boundary matters. The receiver never reaches the controller or the battery nodes directly. It opens a TCP connection to the one device fitted on the kart, and everything else on the kart sits behind that device on the CAN bus.
Which device is fitted changes what the receiver does, which is why the two TCP lines in the diagram are drawn differently:
- With an ECAN, the line is two way. The receiver’s request frames travel over TCP to the ECAN, which puts them on the CAN bus, and the node answers come back the same way. The receiver is doing the polling, through the ECAN.
- With a DAQ, the line is one way. A DAQ replaces the ECAN entirely and polls the nodes itself, so the receiver only listens to what the DAQ sends. The same DAQ also records whole runs and posts them to the local API, which is the red path.
This is the reason the byte order setting in
ip-config.json is a property of the fitted device rather than of the kart. Swap the device and the setting may need to change, even though nothing about the kart has. See Fixing The Byte Order For An ECAN.The Two Halves
The dashed boxes are the two places code runs, and the split between them is the thing to understand first.The Two Streams
Line colour in the diagram is the stream, because the two barely touch until the very end. Charging data is continuous. The receiver holds a TCP connection to each kart’s fitted device, and the frames it reads travel over NATS to be decoded and written into InfluxDB. It is converted on the track machine, by an engineer working the dashboard, and nothing does it automatically. DAQ runs are discrete. A unit on the kart records a whole run, posts it to the local API, and that API zips it and puts it in S3. Landing in S3 is what triggers conversion, which happens in AWS, and the whole path from there is automatic. They meet in the STL database, which is where an engineer syncs from.Note what the diagram shows about the receiver: internal signals go straight to the
telemetry_data subject and skip the decode stage entirely. That is why a kart with nothing decodable still produces measurements. See Internal Signals.Where The People Are
Two of the boxes are people, and both are load bearing.What The Diagram Leaves Out
Deliberately, so that it stays readable:- How the containers get there. Images are built and pushed to ECR, and the
distribution/folder is published to S3, by a CDK pipeline. See Deployment and the Pipeline. - The NATS cluster is three nodes, drawn as its two subjects rather than its three containers.
- Replica counts beyond the two services that are scaled, and the internals of each container.
- The kart fleet is many karts. One kart is drawn, but the receiver holds a connection per fitted device, and more than one per kart where a kart exposes several.